Your Ads Are Lying


Your Ads Are Lying, And It's Costing You a Fortune
Let’s be real for a second. You’re staring at your ads manager dashboard. The Click-Through Rate (CTR) is fire. Traffic is pouring into your site. On the surface, you’re crushing it. You feel that little dopamine hit as you watch the numbers climb, thinking, “This is it. This is how we scale.” But deep down, there’s a nagging feeling. Your bank account isn’t growing as fast as your vanity metrics. Sound familiar?
Your ads are lying to you. I learned this the hard way, burning through a budget that would make most founders cry. There's an old saying: "What gets measured gets managed." But what happens when you’re measuring the wrong damn thing? You end up “managing” your business straight into a ditch. I was obsessed with top-of-funnel metrics, celebrating every cheap click and high-traffic campaign. The problem? I was spending a fortune to attract window shoppers—customers who’d grab a 40% off coupon, make one purchase, and disappear forever. These ads weren't assets; they were unprofitable black holes disguised as wins.
The pivot point for me was a painful end-of-quarter review. We’d hit all our traffic goals, but our profit margins were getting squeezed to death. That’s when I realized the real story isn’t told on the Facebook Ads dashboard. The truth is hidden in the post-click journey, in the repeat purchase rates, and in the true cost to acquire a customer who actually sticks around. To scale your eCommerce brand without setting your money on fire, you have to stop taking your ad data at face value and learn to read between the lines. This is your guide to uncovering the truth.

The Big Lie: Why Your Best-Performing Ads Are Draining Your Budget
You’re running a campaign. The creative is on point, the targeting is dialed in, and the clicks are cheap and plentiful. The ad platform is flashing green lights, telling you this campaign is a top performer. So you do the logical thing: you pour more money into it. A week later, you see a spike in first-time customers. Success, right? Not so fast.
This is the most common and dangerous trap in eCommerce advertising. We get so hypnotized by surface-level metrics—CTR, impressions, even initial Cost Per Acquisition (CPA)—that we fail to ask the most important question: Are these customers actually profitable? I once ran a campaign that had a phenomenal CPA and brought in hundreds of new customers. We celebrated it as a massive win until we looked at the six-month data. Almost none of those customers ever bought again. They were one-and-done discount hunters. The campaign looked great on paper, but in reality, it was a cash-incinerating machine.
My "aha!" moment came when I stopped looking at ad performance in a vacuum and started connecting it to our store's backend data. I stopped asking, "How much does a click cost?" and started asking, "What is the long-term value of a customer from this specific ad?" That shift in perspective changed everything. The real story isn't about getting a click; it's about what happens after the click. It's about session quality, repeat purchases, and understanding the true cost to acquire a quality customer. To grow sustainably, you have to become a data detective. This guide is your magnifying glass.
Finding the Truth: How to Redefine "Success" in Your Ad Campaigns
So, how do we stop the lies? We start by changing the rules of the game. We have to redefine what a "successful" campaign actually looks like, moving away from vanity metrics and toward cold, hard profit.
Moving Beyond Clicks and Conversions
"But wait," you might ask, "aren't traffic and first-time conversions the whole point?" In a way, yes, but they're just the first chapter of the story, not the whole book. A campaign that drives a ton of first-time buyers who use a steep discount and have a negative contribution margin is a loss, no matter how low the initial CPA is. The goal isn't just to make a sale; it's to acquire a customer who will contribute to your bottom line over time.
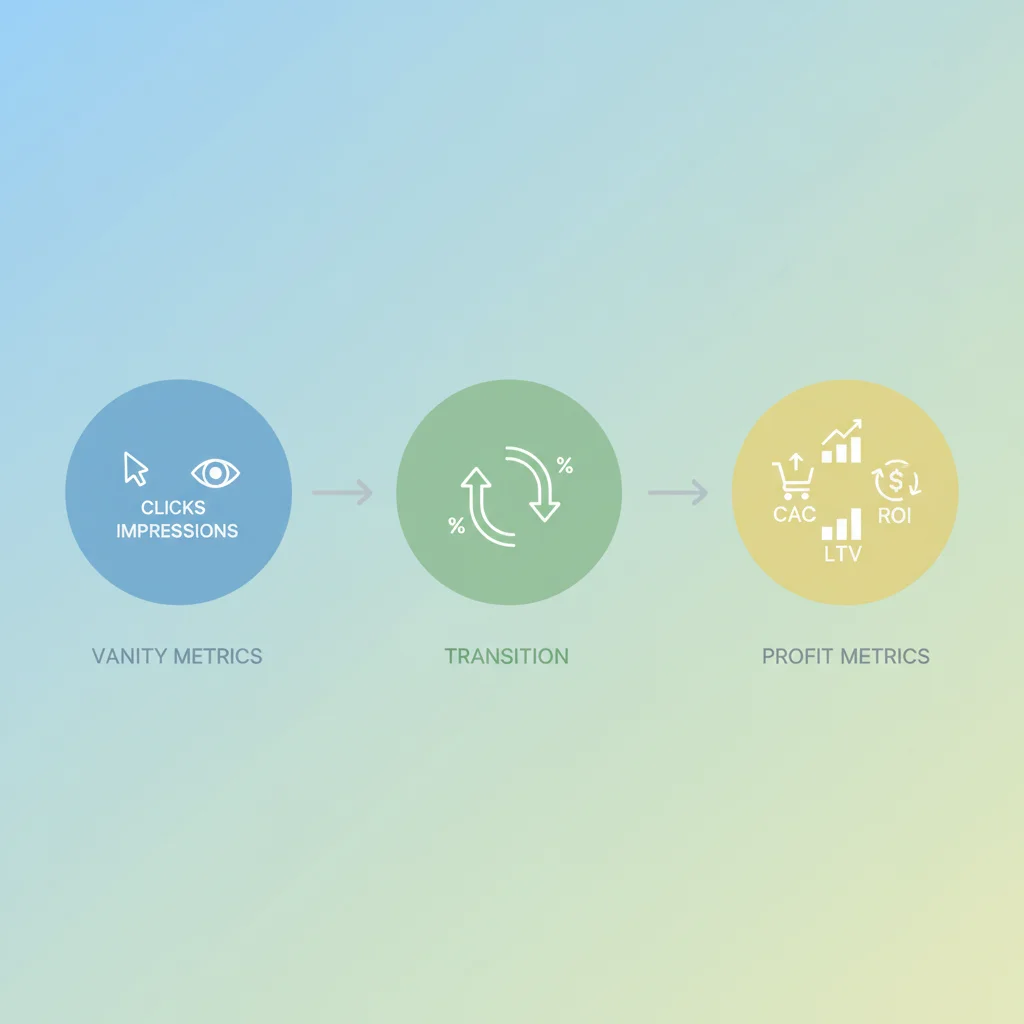
This means your new goals need to be smarter. Instead of just "more traffic," think "higher quality traffic." Instead of just a blended "CPA," you need to obsess over your Customer Acquisition Cost (CAC) per channel and cohort. Most importantly, you need to measure every campaign's contribution to Lifetime Value (LTV). These are the metrics that connect your ad spend directly to profitability and tell you the real story of your performance.
The Metrics That Tell the Real Story
Let's be clear: not all data is gold. In my early days, I would download massive spreadsheets of data, completely overwhelmed and obsessing over things like impression share and frequency caps. Those things have their place, but they don't drive strategic decisions. You need to focus on the metrics that actually help you decide where to invest your next dollar.
Here are the "decision-driving" metrics you should be tracking relentlessly:
- Advanced CAC: Forget blended CAC. It's a vanity metric that hides the truth. You absolutely must know your CAC for each specific channel (Facebook Prospecting vs. Google Branded Search vs. TikTok Influencer) and ideally for specific customer cohorts. This is where multi-touch attribution tools become your best friend, helping you understand which touchpoints actually contributed to the conversion.
- Traffic Quality: Bounce rate alone is a garbage metric. It tells you nothing without context. Instead, look at session quality metrics that signal real intent. What's the pages per session for traffic from a given ad? How much time are they spending on site? Are they triggering micro-conversions like adding a product to the cart, signing up for your newsletter, or watching a product video? High-intent traffic is worth paying more for.
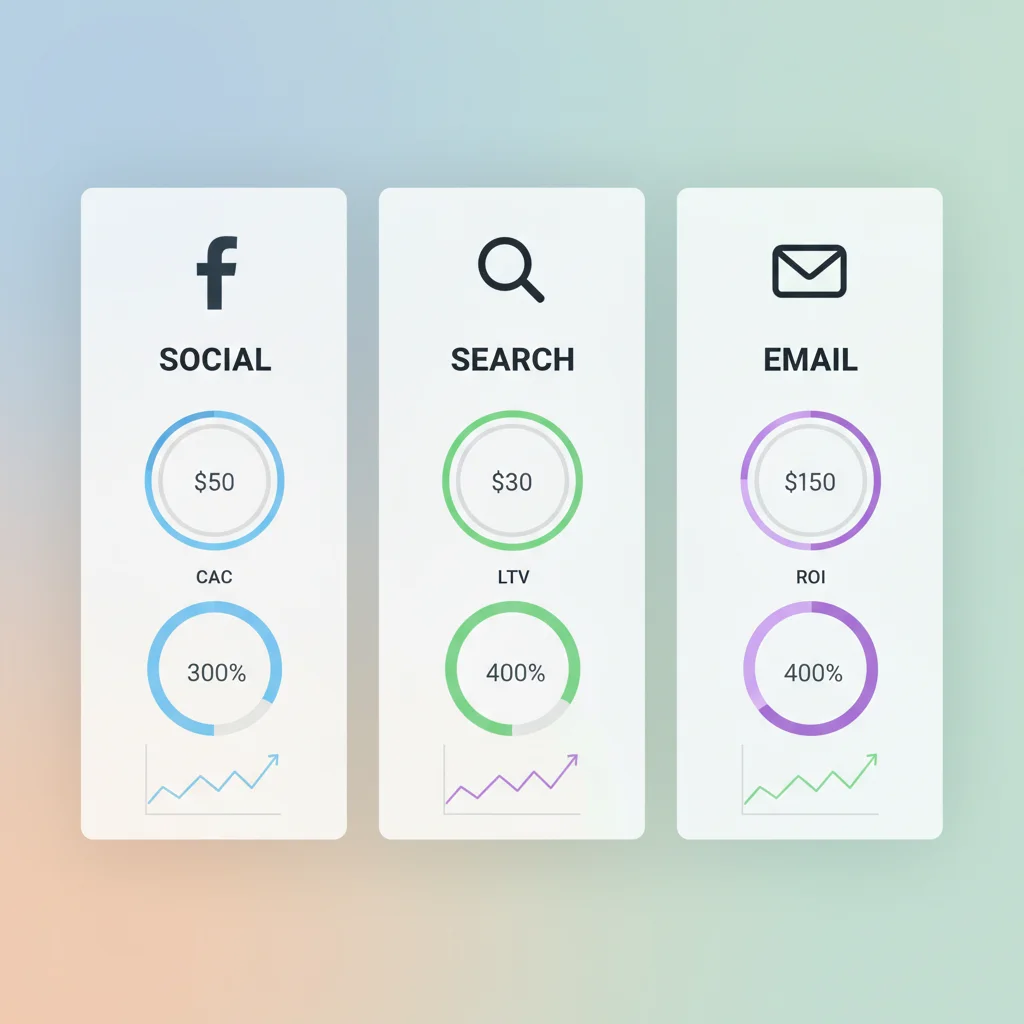
- Revenue-Linked Metrics: This is where the rubber meets the road. Revenue Per Visit (RPV) is a fantastic metric for understanding the immediate ROI of your traffic sources. Even better is tracking cohort LTV attribution. This allows you to see which channels bring in customers who not only buy once but keep coming back for more. When you can say, "Customers from our Google Shopping ads have a 2x higher LTV than customers from our Instagram ads," you’ve unlocked the key to profitable scaling.
Building Your "Lie Detector": The Tech and Tactics for Accurate Data
Knowing which metrics to track is one thing. Actually tracking them accurately is a whole other beast. I remember the nightmare of trying to reconcile reports from Shopify, Google Analytics, and Facebook. They all told a different story. The clicks never matched, the revenue was off, and I realized my entire data foundation was built on quicksand. The problem wasn't the reports; it was my setup. To see the truth, you first need to build a machine capable of capturing it.
Setting Up Flawless Tracking: Your first step is to master event tracking. Tools like Google Tag Manager (GTM) are non-negotiable. It allows you to go beyond simple pageviews and track the specific actions users take—like clicking "Add to Cart," applying a promo code, or engaging with a size guide. In today's world of ad-blockers and privacy updates (looking at you, iOS 14), server-side tracking has become a game-changer for accuracy. By sending data from your server directly to platforms like Facebook or Google, you bypass browser-level interruptions, giving you a much cleaner and more reliable data set.
Unifying Your Data Sources: The second step is to break down your data silos. You can't see the full picture if your Facebook, Google, TikTok, and Klaviyo data all live in separate, disconnected universes. You need a central source of truth. Platforms like Segment, Mixpanel, or even a well-configured GA4 can pull all your data into one place. The benefit is transformative: instead of seeing isolated and often misleading data points, you can finally map the entire, unified customer journey from their first ad impression to their tenth purchase.
Mapping the Journey: Once your data is unified, you can do incredibly powerful things. For example, we once worked with an influencer who was driving a ton of clicks, but sales were flat. By mapping the customer journey in our analytics tool, we saw a massive 90% drop-off on the product page. Digging in, we realized the landing page vibe and messaging were a total mismatch for the influencer's audience. We spent an hour tweaking the headline and swapping the hero image to align better. The result? An immediate 18% lift in conversions from that channel. That’s the power of having clean, connected data.
The Interrogation Room: Analyzing Channels, Cohorts, and Experiments
With your "lie detector" built, it's time to put your marketing efforts on trial. This is the fun part—where you use your clean data to ask tough questions and make smart, profitable decisions. You'll move from "I think this is working" to "I know this is working, and here's by how much."
Putting Each Channel on Trial
Let's get one thing straight: not all channels are created equal. Treating them the same is a recipe for wasted spend. You need to analyze each one based on its unique strengths and the intent of its users.
- Paid Social (Facebook, Instagram, TikTok): Stop lumping all your campaigns together. You need to analyze prospecting vs. retargeting separately. Their goals and target CPAs are completely different. The real pro move? Build your lookalike audiences from a seed list of your high-LTV customers, not just a list of all purchasers. This tells the algorithm to find more people like your best customers, not just anyone who will make a single purchase.
- Paid Search (Google Ads): The magic of search is intent. You need to separate your brand vs. non-brand keyword campaigns. Someone searching for your brand name is already sold; that's a cheap, defensive click. Someone searching for a non-brand term like "sustainable running shoes" is in discovery mode. You need to analyze the profitability of these terms and focus your budget on the ones that bring in valuable new customers, not just those with the highest click volume.
- Email & Affiliates: Don't just look at open rates and clicks. Track the LTV of customers acquired through your welcome series. For influencers, ditch the vanity metrics. I once paid an influencer who drove thousands of clicks but, after tracking with a unique discount code, we found they generated a grand total of three low-value sales. We cut them immediately. The real ROI is in the revenue and the quality of the customers they bring, period.
Uncovering Hidden Patterns with Cohort Analysis
Here's a quote to live by: "Numbers tell stories you don’t see in averages." Averages lie. Your blended repeat purchase rate might be 30%, but a cohort analysis can reveal that customers acquired during your Black Friday sale have a 10% repeat rate, while those acquired from a Google Search ad in February have a 50% repeat rate.
A cohort is simply a group of users who share a common characteristic, like their first purchase date, the channel they came from, or the first product they bought. By breaking down your data into these groups, you can uncover jaw-dropping insights. You’ll see exactly which channels, campaigns, and even discount offers bring in the most profitable, loyal, and repeat customers. This isn't just interesting data; it directly informs your CAC targets and LTV predictions, allowing you to invest with surgical precision.
Running Experiments That Actually Drive Growth
Your intuition can be expensive. In marketing, the only way to find truth is to test. But you need to run experiments that are designed to answer specific, important questions, not just change a button color for the sake of it.
- Channel-Specific Landing Pages: Does traffic from TikTok convert better on a video-heavy landing page? Test it.
- Cohort-Specific Creative: Do customers who bought Product A respond better to ads cross-selling Product B or Product C? Test it.
- Data-Driven Discounting: Does offering a 20% discount bring in customers with a higher LTV than offering free shipping? Test it.
For every experiment, you must track one ultimate metric: incremental revenue. The goal is to prove that your test generated more actual profit than the control. That’s how you build a reliable, data-driven growth engine instead of just guessing your way forward.
From Detective to Fortune Teller: Using Data to Predict the Future
Once you’ve mastered analyzing the past, you can unlock the ultimate competitive advantage: predicting the future. The future isn't a mystery; it's a pattern waiting to be recognized. By using your historical data, you can move from reactive optimization to proactive, data-driven forecasting.
Imagine this: a new, trendy ad channel pops up, and every guru is screaming that you need to be on it. The CPCs are dirt cheap. The old you would have jumped in headfirst. The new you runs a forecast. Using historical data from similar audiences and channels, your model predicts that while the acquisition cost might be low, the LTV of customers from this channel will be abysmal. You confidently pass, avoiding a costly mistake, and instead double down on the channel your data proves is scalable and profitable. That’s the power of predictive analytics.
You don't need to be a data scientist to start. You can begin with simple regression models in a spreadsheet to forecast CAC and ROI. The most powerful application is forecasting LTV by acquisition channel and cohort. When you know with a high degree of confidence that a customer acquired via Google Search will be worth $250 over their lifetime, you know exactly how much you can afford to bid to acquire them. This removes the guesswork from scaling and allows you to invest aggressively and confidently where it counts.
Your Action Plan: Turning Truth into Profitable Growth
Okay, we've covered a lot. You've learned why your ads are lying, how to find the truth, and how to use it to make smarter decisions. Now, let's turn all this insight into an actionable plan.
Building Your "Truth Dashboard"
Your goal is to create a dashboard for decision-making, not just reporting. It should be clean, simple, and free of vanity metrics. I recommend a two-layer approach:
- The Executive View: This is your high-level dashboard. It should have just a few core metrics that tell you about the overall health of your business: Blended ROI, overall LTV to CAC ratio, and gross margin on ad spend.
- The Team-Level View: This is the granular, in-the-weeds dashboard for your marketing team. It breaks down performance by channel, campaign, and ad set, focusing on metrics like channel-specific CAC, conversion rates, and micro-conversions. This is where your team lives day-to-day to optimize performance.
Your Next Steps to Stop the Lies
Feeling overwhelmed? Don't be. You don't have to fix everything overnight. Progress is the goal, not perfection. Here’s where to start:
- Track the Right Metrics: Start by getting your tracking in order. Set up server-side tracking and begin focusing on cohort LTV and channel-specific CAC.
- Analyze Your Cohorts: Pick one channel and run a cohort analysis. Do customers from your Facebook ads repeat-purchase more or less than customers from Google? The answer will likely surprise you.
- Optimize Your Channels: Based on your analysis, re-evaluate your budget. Shift spend away from channels that bring in low-LTV customers and toward those that bring in loyal fans.
- Scale with Confidence: Run one small, measurable experiment this week. Test a new landing page or a different offer. Let the data, not your gut, tell you what works.
The final piece of advice is this: Start small. Your goal is to build a system, not just a single winning campaign. By continuously tracking what matters, asking the right questions, and testing your assumptions, you’ll stop being misled by your ads and start building a truly scalable and profitable eCommerce business.

Antriksh Tewari
Head of Digital Marketing
Antriksh is a seasoned Head of Digital Marketing with 10+ years of experience who drives growth across digital, technology, BPO, and back-office operations. With deep expertise in analytics, marketing strategy, and emerging technologies, he specializes in building proof-of-concept solutions and transforming them into scalable services and in-house capabilities. Passionate about data-driven innovation, Antriksh focuses on uncovering new opportunities that deliver measurable business impact.